
Animated Infographic GIF: 6 Steps to Build Your Own
Learn how to build an animated infographic GIF in six steps: fixed canvas, simple SVG motifs, one render function and a seamless loop.
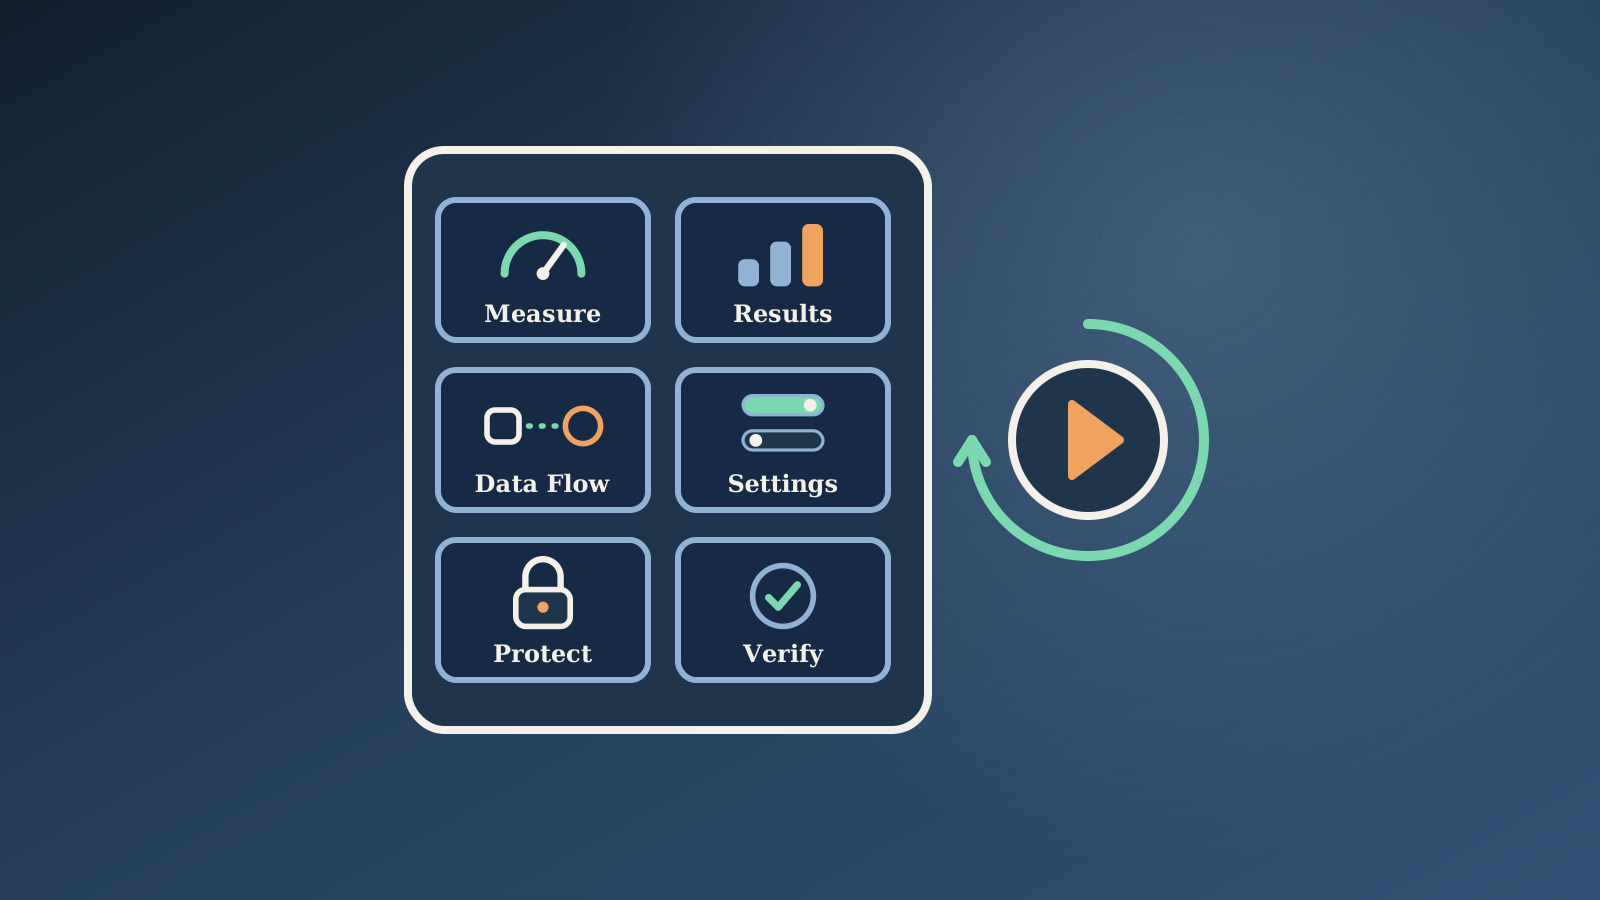
A still image gets a quick glance. An animated infographic gets a second look, because something on it moves. I wanted one for my LinkedIn posts, so I built a small generator that turns six short points into a looping GIF. This post shows how it works, in six steps you can copy.
The whole thing is plain HTML, SVG and a script. No design app and no video editor. I like jobs that run the same way every time, which is the same reason I automate my website backups. With a generator like this, a new infographic only needs six short points from me.
1. Fix the canvas before you draw anything
Pick the size first and never change it halfway. I use a portrait 1080 by 1350 canvas because it fills a phone feed. At the top sits a small header with the title and a badge. Below it is a grid of two columns and three rows.
Each of the six tiles has the same parts: a number, a short title, a small diagram and a one-line caption. The cheat-sheet style I liked had twelve tiles, but at this size the captions become too small to read on a phone. Six is the sweet spot. You trade some content for text people can actually read.
Set hard limits for the text too. In mine, a tile title stays under about 18 characters and a caption under about 34. If a caption wraps to two lines, the tile layout breaks, so the limit is part of the design.
2. Draw each diagram as a small SVG motif
Every tile has its own small SVG drawing area. I call each drawing a motif. A motif is a short function that does two things. It draws a few shapes once, and then it returns a second function that moves those shapes.
I built ten of them: a gauge, a shrinking picture, a data flow, a hub with spokes, a set of toggles, a bar chart, a lock, a refresh arrow, a server stack and a magnifier. Pick the closest metaphor for each point. A gauge fits "measure first". A lock fits security. Toggles fit "switch off what you do not use". Vary them, so the grid does not look repeated.
3. Drive every frame from one render function
You could animate with CSS keyframes, but a headless browser cannot play them at a pace you control while you take screenshots. I use one function instead. It takes a time value, and it sets the position of every moving part for that exact moment.
The benefit is that you can ask for any moment and get exactly that frame, every time. The cost is more code than a few CSS lines. For a file you build once and ship, I take that trade. Frame-exact output matters more than short code.
4. Make every movement repeat once per loop
A GIF restarts when it ends, so anything that does not return to its starting point shows up as a jump. My loop is two seconds long. I use a phase value that runs from 0 to 1 over that time, and every motion is built so it ends where it began.
A needle swings with a cosine. Bars breathe with a sine. Dashed lines slide by a whole number of dash lengths. The refresh arrow turns exactly one full circle. If you add a new motif, test that rule first.
I started with a fade-in at the start and a fade-out at the end. Then I removed both. Without them every tile is visible from the first frame, and the loop has no cut at all. You lose the entrance effect, but the image reads at once in a feed and loops smoothly.
5. Capture the frames and build the GIF
Open the page in a headless browser such as Playwright, then call the render function once per frame and take a screenshot each time. I use 24 frames at 12 frames per second, which covers the two-second loop.
Then ffmpeg builds the GIF in two passes. The first pass looks at all the frames and builds a colour palette. The second pass applies it. This gives much cleaner colours than the default one-pass conversion. Flat colours and line art compress very well, so my first sample came out at about 0.4 MB at full width.
Leave photos out of this kind of image. They make the file much bigger and they look speckled once the colours are reduced.
6. Check your animated infographic before you ship it
I make a contact sheet with four frames side by side and look at it before showing anyone. I check three things. Titles and captions each stay on one line. Nothing is cut off or overlapping. The four frames are clearly different, so I know the motion works.
Then I check the file size. Social feeds limit GIF size, and I believe LinkedIn's limit is about 5 MB, though I have not confirmed it. My script aims for under 4.5 MB and retries at a smaller width and fewer colours if the file is too large.
One honest gap: I have not yet uploaded this to LinkedIn. I still need to confirm that its editor keeps the animation, so I keep a still frame as a fallback.
What I would do next
Once this worked, I saved the whole process as a reusable step in my publishing workflow. It is the same idea I wrote about in WordPress agent skills, from Figma design to block: turn a repeat job into something you can run again without thinking.
If you want a workflow like this built for your own site or content, take a look at my AI-assisted development and automation service or get in touch.